Understanding the Time in Process Report
This guide explains how Ashby's Time in Process template report works, including which candidates and stage transitions are counted, how the median is calculated, and how a few edge cases (especially small candidate counts) can lead to results that differ from a manual spreadsheet calculation.
A quick note on terminology: for readability, this guide talks about "candidates" moving through stages. Technically, the time being measured belongs to a Job Consideration (sometimes called an application), which is the record of one candidate's progress toward one specific job. A single candidate can have several Job Considerations if they're being considered for multiple roles, and each one moves through stages independently and is counted independently in the Time in Process report.
In Ashby, two things are called "Time in Process." In addition to this report, Ashby also exposes a Job Consideration field called Time in Process (Days). That field is a single per-application duration (days from application start, or most recent unarchive, until consideration ended).
The report described in this doc is different: it measures the median time spent in each stage, computed across many candidates. The two are not directly comparable, and the sum of stage medians from the report will not equal the field value on any single application.
What is the Time in Process report?
For report template basics, see Report Catalog: Templates .
The Time in Process template report shows the median number of days candidates spent in each interview stage of your hiring process. It's intended to answer questions like:
- "What is the typical time a candidate spends in Phone Screen before moving on?"
- "Which stage is the slowest part of our pipeline?"
- "Have certain stages gotten faster or slower over time?"
For each stage that meets the report's filters, the report computes the median of all completed stage durations across the candidate cohort, where a "stage duration" is the time between when a candidate entered that stage and when they left it.
The result is one row per stage (or per stage type, depending on your settings) with the median days in that stage as the headline metric.
Default template configuration
You can access the Time in Process template by navigating to Reports > Report Builder > Report Templates > Time in Process. When you open the Time in Process template, it is preconfigured as follows. You can adjust any of these in the report settings.
Setting | Default |
|---|---|
Subject | Applications |
Timeframe | Rolling 6 months, based on each candidate's most recent interview date |
Group Stages | On for Ashby Analytics orgs and orgs using Grouped Interview Plans, off otherwise |
Hide application review stages | Yes |
Hide lead stages | Yes |
Hidden stage groups | None |
Visualization | Stacked bar chart |
Visualization settings
These settings are located under the Visualization menu on the left side of the report template.
Available visualizations
- Stacked bar chart: Each bar is a candidate cohort (or other grouping); stages are stacked within the bar, so the total height shows the combined median time across stages.
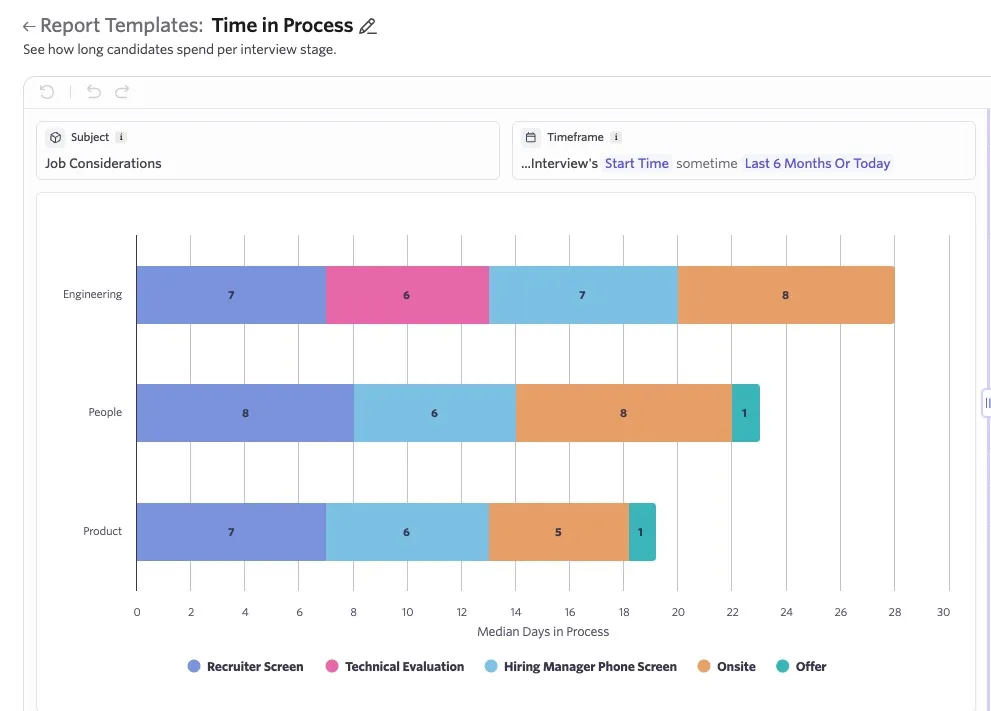
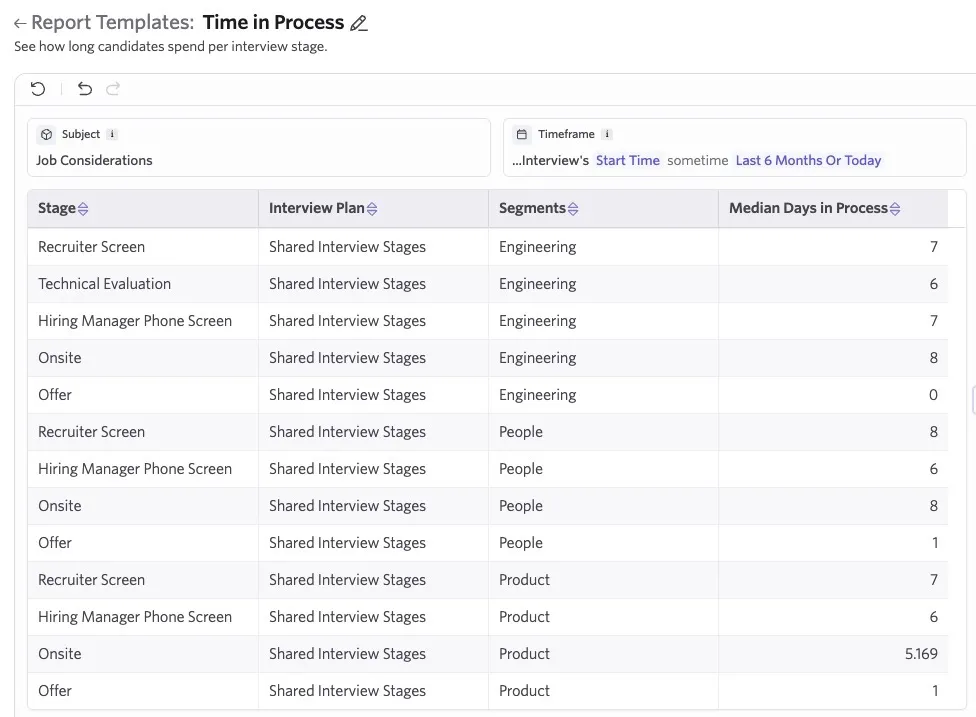
- Table: One row per stage (or per stage and grouping), with the median days in process as a column.
What "Group Stages" does
This toggle controls whether the report reports on individual interview plan stages or on the Stage Groups they map into. Stage Groups are the primary pipeline milestones (e.g. "Recruiter Screen," "Onsite," "Offer") that an admin can define via Grouped Interview Plans, with individual stages from different interview plans mapped into them.
- Off: Each individual interview plan stage is reported on its own. "Phone Screen" in Job A and "Phone Screen" in Job B appear as two separate rows, even if both map to the same Stage Group.
- On: Stages are rolled up into their Stage Groups. All stages that map into a given Stage Group, across every job and interview plan, are pooled into a single row for that Stage Group.
The grouped view is most useful when you have Grouped Interview Plans configured and want a consistent, company-wide view of pipeline speed at the milestone level. The ungrouped view is most useful when interview plans differ meaningfully across roles or departments and you want to see each stage in its own context.
What "Hide application review stages" and "Hide lead stages" do
These options remove Application Review stages and Lead stages from the report. They are hidden by default because most customers think of "time in process" as time spent in active interviewing; the time a candidate spends in Application Review or as a Lead is a different category of activity. You can re-enable either category from the report settings.
What "Hidden stage groups" does
This lets you explicitly remove individual stage groups (by name) from the report, even if they would otherwise be included by stage-type rules. This is useful for custom stages that don't fit the standard pipeline view.
What is included in the calculation?
Each stage's median is computed from a pool of stage visits. A stage visit is one period of time a candidate spent in a given stage, from the moment they entered it to the moment they left it. Detailed explanations of the calculation critieria are provided below.
Candidates must have exited the stage
Visits where the candidate is still in the stage are excluded. The report only counts time the candidate has actually finished spending in a stage. Until a candidate moves out of a stage (by advancing, being archived, or being hired), that in-progress visit contributes nothing to the median.
Very short visits are still counted
Even very brief stage visits are included as data points in the median. For example, a candidate who was moved into a stage and then almost immediately moved back out, perhaps because of an accidental click that was corrected within seconds, would be shown in the report. The report does not apply a minimum duration to qualify a visit. If you notice a stage's median is unexpectedly low, it's worth checking whether there were a small number of accidental short transitions inflating the data; those can have an outsized effect when the overall number of completed visits is small.
All eligible candidates' visits are pooled together
The median for a given stage is computed across every completed visit by every eligible candidate. There is no per-candidate averaging or deduplication beforehand. If three candidates spent 3, 7, and 10 days in Phone Screen, the median for Phone Screen is the median of [3, 7, 10], not the median of some pre-aggregated per-candidate value.
Multiple stage visits are counted individually
When a candidate re-visits a stage (for example, after being unarchived back into the pipeline, or because they were moved back from a later stage), each completed visit counts as its own interval.
For example, if a candidate goes Phone Screen → Archived → Unarchived → Phone Screen again → Onsite, that candidate contributes two Phone Screen intervals to the median: one ending when they were archived the first time, and one ending when they later moved to Onsite. If they were still sitting in Phone Screen the second time around, only the first visit would count — the second has not finished yet.
Excluded stages
The following stage types are always excluded from the report:
- Archived stages: Moving a candidate into an archived state is not itself "time spent interviewing."
- Hired stages: Being hired is the end of the process, not a stage you measure.
The following stage types are excluded by default but can be turned back on in the report settings:
- Application Review stages: Controlled by the "Hide application review stages" option.
- Lead stages: Controlled by the "Hide lead stages" option.
You can also explicitly hide additional stage groups via the "Hidden stage groups" setting.
How the cohort of eligible candidates is chosen
The report uses a timeframe to decide which candidates are in scope. For example, in the default template, the timeframe is "candidates whose most recent interview occurred in the last 6 months." Any candidate that falls in that selected date range is fully in scope; once a candidate is included, all of their completed stage visits contribute to the medians, even visits that happened before the selected date range. The timeframe selects the cohort of candidates, not the individual stage visits.
Any other filters you add to the report (job, source, department, etc.) further narrow the cohort the same way.
How the median is calculated
The report uses a discrete median: it returns an actual stage duration that appeared in the data. It does not average the two middle values when there's an even number of data points.
Specifically:
- The completed stage durations are sorted from shortest to longest.
- The median is the value at position ceil(n/2), where n is the number of durations.
When n is odd, this is the usual "middle value" definition. When n is even, this returns the lower of the two middle values rather than averaging them.
This means every median the report shows is a real stage duration that some real candidate actually experienced. The tradeoff is that with very small samples, especially n = 2, the result can look different from what you'd compute as a simple average of the two values.
Worked examples
Imagine a stage where the completed durations (in days) are as follows. The table shows what a typical "arithmetic median" calculation would give versus what the Time in Process report returns:
Number of completed visits | Sorted durations (days) | Manual median you might calculate by averaging the middle values | What the report shows |
|---|---|---|---|
1 | [5] | 5 | 5 |
2 | [3, 9] | 6 | 3 |
3 | [3, 6, 9] | 6 | 6 |
4 | [3, 6, 9, 12] | 7.5 | 6 |
5 | [3, 6, 9, 12, 15] | 9 | 9 |
6 | [3, 6, 9, 12, 15, 18] | 10.5 | 9 |
The differences appear only on even-sized samples. For odd n, the two methods agree. As n grows, the difference between the two approaches becomes smaller in relative terms and is most pronounced when only two candidates have completed a stage.
If you're trying to reconcile the report with a manual calculation and you have a small number of candidates per stage, this is almost always the explanation.
FAQs
I only have 2 candidates who completed this stage. My math says the median should be 6 days, but the report shows 3.
This is the most common Time in Process question, and it is expected behavior. The report uses a discrete median that returns the lower of the two middle values rather than averaging them. With two durations of 3 and 9 days, the report returns 3. See the worked examples above.
Why isn't a stage showing up at all?
There are a few possibilities:
- The stage is a Lead or Application Review stage and the "Hide" options are still set (the default).
- The stage is an Archived or Hired stage type — these are always excluded.
- The stage is in the Hidden stage groups list.
- No candidates have completed a visit to that stage within the report's cohort. A stage that only has candidates currently sitting in it will not appear, because in-progress visits don't count.
Are candidates currently in a stage included in the number?
No. Only completed stage visits are counted. Until a candidate leaves a stage (by advancing, being archived, or being hired), their time in that stage is not yet measured.
Why is my median so low? It looks like seconds or zero days.
The most common cause is accidental short stage moves; for example, a recruiter advancing a candidate to the wrong stage and immediately correcting it. Those brief visits are counted as completed stage visits and become data points in the median. When the total number of completed visits for a stage is small, even one or two near-zero visits can pull the median down dramatically. Reviewing the underlying stage transitions for the affected stage will usually surface the culprit.
What about candidates who were archived and then unarchived?
The report does not "stitch" together separate visits into one combined duration. Each completed visit is its own interval in the median calculation. The Job Consideration field Time in Process (Days) behaves differently — it resets on unarchive — but the report treats each completed stage visit as an independent data point regardless of whether it happened before or after an unarchive.
My report and a colleague's report on the same template show different numbers. Why?
The most common reason is permissions. The report's eligible-applications cohort respects your object access rules, so two users on the same organization can see different application sets and therefore different medians. Other reasons include different report filters, a different date range, or one report set to per-stage view while the other uses the unified stage-type view.
Why is this called a "median" when my intuition says I want an average?
The median is much more resistant to outliers than the mean. One candidate who sat in a stage for 300 days (perhaps because they were forgotten about, or because they were reactivated months later) can dramatically inflate an arithmetic average, painting a misleading picture of typical hiring speed. The median answers "what's the typical candidate's experience in this stage?" more reliably. For a small number of candidates, switching to the median has tradeoffs (see the discrete-median note above), but for typical pipeline sizes it produces a more useful number.
Summary
- Time in Process measures the median days candidates spent in each stage, computed across all completed stage visits in your cohort.
- A visit only counts once the candidate has left the stage. In-progress stages contribute nothing.
- Every completed visit is its own data point, including repeat visits by the same candidate.
- Archived and Hired stage types are always excluded; Lead and Application Review stages are excluded by default but can be turned back on.
- The median is a discrete median: with even-numbered samples it returns the lower of the two middle values rather than averaging them. This is the usual explanation for "the report shows 3 days but I calculated 6."
- For small candidate samples (especially n = 2), expect the report to differ from a simple manual median calculation.
- The Job Consideration field Time in Process (Days) is a separate metric on individual applications and is not directly comparable to this report's values.